Spectroscopy
Core to the family of energy loss techniques is spectroscopy. Here, the analysis of the energy distribution of the electrons is used to determine the local properties of a specimen, including the type and quantity of atoms present, the bonding and chemical state of atoms, and the collective interactions of atoms with their neighbors.

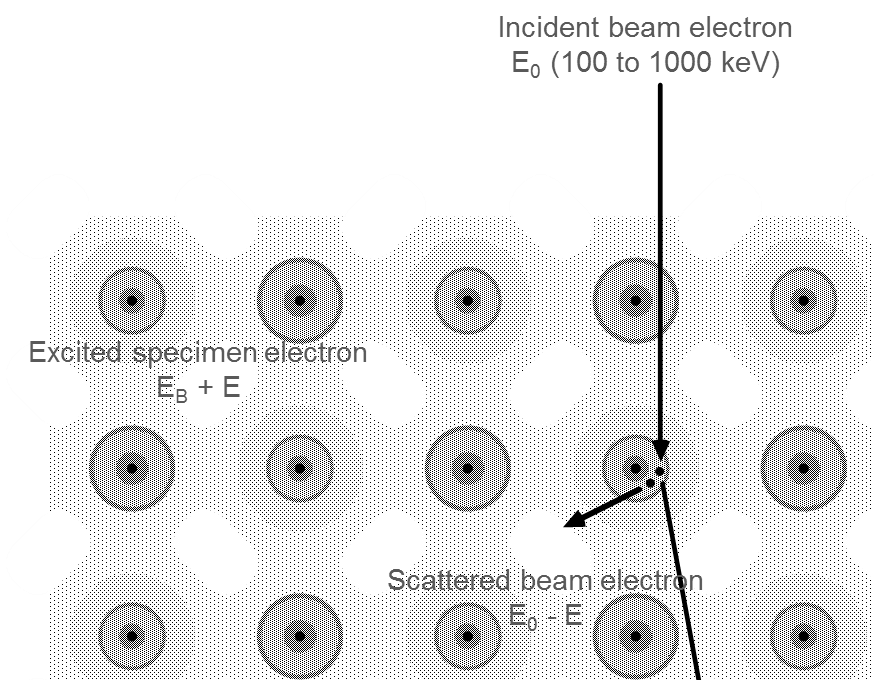
As electrons pass through a specimen, they interact with the atoms present. Many of the electrons pass through the thin sample without losing energy. A fraction of electrons will undergo inelastic scattering and lose energy as they interact with the specimen, leaving the sample in an excited state. The material can deexcite when it gives up energy, typically in the form of visible photons, x-rays, or Auger electrons.

As the incident electron interacts inelastically with the sample, its energy and momentum change. This scattered incident electron is detected in the spectrometer, giving rise to the electron energy loss signal. The sample electron (or collective excitation) carries away this additional energy and momentum.

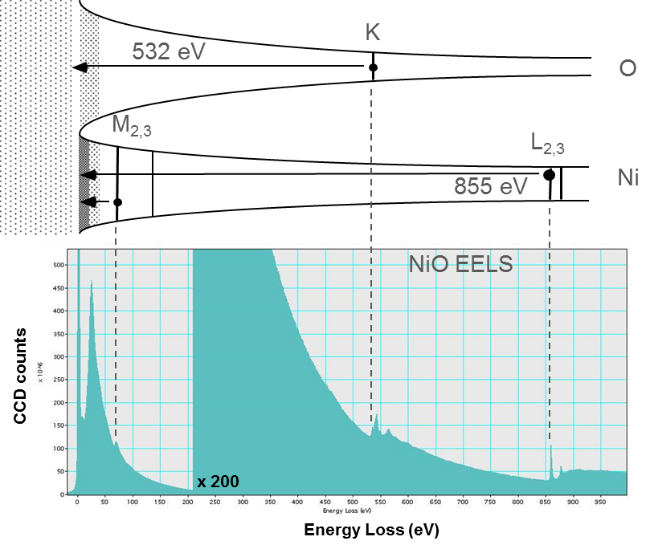
Core-loss excitations occur when the incident electron promotes tightly bound core electrons to a higher energy state. The core electron can only be promoted to an empty state in the material. These empty states can be bound states in the material above the Fermi level (so-called antibonding orbitals in the molecular orbital picture). The states can also be free electron states above the vacuum level. The sudden activation of the scattering at the Fermi energy and the probing of empty states makes the EELS signal sensitive to both the atom type and its electronic state.

Aligning the Fermi level with the spectrum's zero-loss peak (ZLP) visualizes the initial spectral features in the core-loss excitations. Edges can now be seen as the point where the electrons lose enough energy to promote the core-level atomic electrons to the Fermi level. This analogy fails to reproduce the scattering above the Fermi level but is useful for visualizing the sudden increase in intensity of the core-level edge.

A typical energy loss spectrum includes several regions. The first peak, the most intense for a very thin specimen, occurs at 0 eV loss (equal to the primary beam energy) and is called the zero-loss peak (ZLP). It represents electrons that do not undergo inelastic scattering but may be scattered elastically or with an energy loss too small to measure. The ZLP width mainly reflects the energy distribution of the electron source. It is typically 0.2 – 2.0 eV but may be as narrow as 10 meV or lower in a monochromated electron source.

Following the ZLP, other low-loss features arise from inelastic conduction or valence electron scattering. This scattering regime can be related to optical excitations of the material and other collective excitations, such as plasmons.
The most prominent peak after the ZLP typically results from a plasma resonance of the valence electrons called a plasmon. In a solid's free electron gas model, you can picture plasmon excitations as the harmonic oscillation of weakly bound conduction electrons and a background of fixed ionic cores. You can relate the oscillation frequency and its energy to the charge carriers' electron gas density and effective mass. Small changes in material properties can affect these values, making the plasmon peak position a sensitive indicator of changes in a material. For example, small amounts of an alloy element can affect the number of carriers (cause a shift in the plasmon energy) or the carrier density (expand the crystal lattice when the local temperature changes). false
Plasmon energy:
where,
= conduction/valence electron density
= electron (hole) charge
= electron (hole) effective mass
= Plank's constant
The next regime includes core-level excitations. This regime arbitrarily starts at ~100 eV loss (but can be lower for states near the conduction band) and extends to the primary beam energy in principle. In practice, energy losses above 5 kV are difficult to measure. Since core electron binding energies differ for each element and each type of shell, the ionization edge threshold can be used to identify which elements are present in the specimen, while you can use the edge intensity to determine the element concentration in the sample.


References
Egerton, R. F. Electron Energy Loss Spectroscopy in the Electron Microscope. Springer. 3rd ed. New York: 2011.