Resources

Showing 1-10 of 24
  • Media Image
    Paolo Longo, Ph.D., Gatan, Inc. Sample courtesy of Dr. Jaco Oliver at NMMU, Port Elizabeth, South Africa Microscope courtesy of NMMU, Port Elizabeth, South Africa

    Analysis of the changes in local carbon structure caused by self-implantation of carbon into diamond and chemistry.

  • Media Image
    Paolo Longo, Ph.D., Gatan, Inc. Sample courtesy of Professor Gianluigi Botton at CCEM, Hamilton, ON, Canada Microscope courtesy of CCEM, Hamilton, ON, Canada Acknowledgement to Dr. M. Bugnet at CCEM for helping set up microscope for experiment.

    Pt/Fe nanocatalysts are among the most promising candidates for accelerating oxygen reduction reaction occurring at the cathode in a proton exchange membrane fuel cell.

  • Media Image
    Paolo Longo, Ph.D., Gatan, Inc. Sample courtesy of Dr. P. Rice and Dr. T. Topuria at IBM (Almaden), San Jose, CA Microscope courtesy of Dr. P. Rice and Dr. T. Topuria at IBM (Almaden), San Jose, CA Acknowledgement to Dr. P. Rice and Dr. T. Topuria at IBM (Almaden) for helping set up microscope for experiment.

    Legend Green: Ti L at 456 eV; red: Sr L at 1940 eV; purple: La M at 832 eV; blue: Mn L at 640 eV Methods Probe-corrected Jeol ARM 200 TEM/STEM microscope; C-FEG emission gun; GIF Quantum® ER system; voltage: 200 kV; data taken in STEM mode; EELS core-loss spectrum (30 – 2300 eV): 1.5 ms; beam cur

  • Media Image
    Paolo Longo, Ph.D., Gatan, Inc. Sample courtesy of Dr. Pavel Potapov at Global Foundries, Dresden, Germany Microscope courtesy of Dr. P. Rice and Dr. T. Topuria at IBM (Almaden), San Jose, CA Acknowledgements to Dr. P. Rice and Dr. T. Topuria at IBM (Almaden), San Jose, CA for helping set up microscope for experiment.

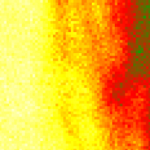
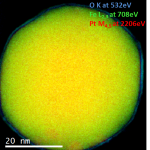
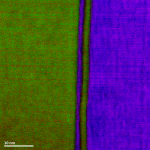
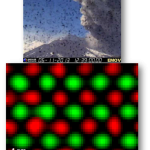
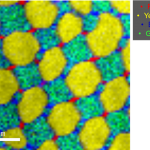
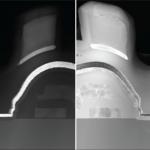
    Methods probe-corrected Jeol ARM 200 TEM/STEM microscope C-FEG emission gun GIF Quantum® ER system Jeol Centurio SDD EDS detector (0.98 sr) O K at 532 eV (red); Ti L at 456 eV (green); Ni L at 855 eV (light blue); N K at 401 eV (yellow); Hf M at 1662 eV (purple) voltage: 200 kV data taken in STEM

  • Media Image
    Paolo Longo, Ph.D., Gatan, Inc. Sample courtesy of Dr. P. Rice and Dr. T. Topuria at IBM (Almaden), San Jose, CA Microscope courtesy of Dr. Giuseppe Nicotra, IMM-CNR, Catania, Italy

    The lab where EELS maps were taken is situated at the slopes of Mount Etna in Sicily, Italy. Mount Etna is the highest active volcano in Europe. The EELS elemental maps were taken at high speed during major volcano eruption, as shown in the volcano webcam photograph above the maps.

  • Media Image
    Paolo Longo, Ph.D., Gatan, Inc. Sample courtesy of Dr. Li Zhou at Ames Lab, Iowa

    EELS data taken using a FEI F20 TEM/STEM microscope equipped with S-FEG emission gun and a fully loaded GIF Quantum® ER system. Methods Voltage: 200 kV; data taken in STEM mode; EELS spectrum (300 – 2300 eV) exposure time: 8 ms; total exposure time:

  • Media Image

    The HAADF signal (left) contrast is easily interpreted in terms of mass thickness of the material while the diffraction contrast MAADF signal (right) reveals highly detailed structural changes in the material. The optimized geometry makes this possible.

  • Media Image
    This work was performed in collaboration with Dr. Phil Rice and Dr. Teya Topuria of IBM Almaden Research Center in San Jose, CA who provided expert assistance as well as the TEM specimen and access to their microscope facilities.

    Colorized EELS elemental map of Ti L2,3-edges at 456 eV (green), Mn L2,3-edges at 640 eV (blue), La M4,5-edges at 832 eV (purple) and Sr L2,3-edges at 1940 eV (red).

  • Publication
    Applied Physics Letters
    Gandman, M.; Kauffmann, Y.; Kaplan, W. D.

    Quantification of ordering at a solid-liquid interface using plasmon electron energy loss spectroscopy

  • Methods

    Step by step instructions on how to prepare a gain reference.

Pages