Identify Elements within Sample
Often, both the beneficial and detrimental properties of a material are determined by its elemental composition. Find out how identifying a spectrum feature at distinct energy ranges allows you to discover what elements are within your sample.
To answer the question of what elements are within your sample, you must first identify the energy position and type of EELS edges within your spectrum. Common edge indicators include:
- Edge threshold energy (e.g., point of steepest rise)
- Edge shape (e.g., delayed features and white lines)
- Accompanying edges (e.g., Si L at 99 eV and Si K at 1839 eV should both be visible)
Reference sources that you may use to identify your edges include EELS Atlas, the Gatan slide rule, and various software (including DigitalMicrograph®, and the EELS iPhone app).

Edge identification can be difficult when presented with complex spectrum edges, plural scattering or close-lying edges. Careful examination of the spectrum (including other edges), prior knowledge of the expected constituent species, and general analytical experience can help overcome this challenge.

Which edges can be used for identification?
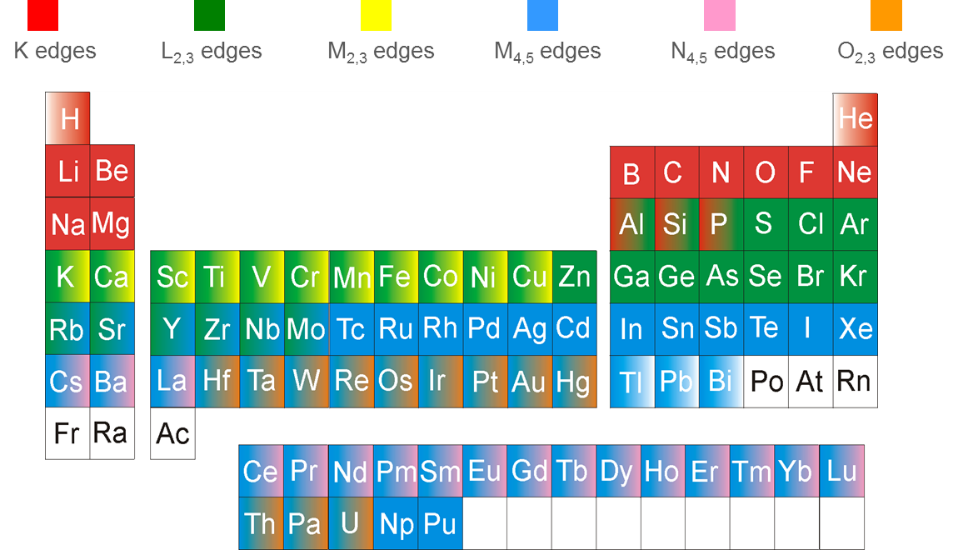
Edges you can use to identify elements within your sample are shown below in the color-coordinated period table below. Edges in the range of 100 and 2500 eV are typically chosen for analysis due to convenience. However, edges outside of this range can also be analyzed.
